
The Blind Spot of the Death Overs: A BPL Collapse Index, a Pre-Registered Prediction, and the Limits of the Model
**মূল উত্তর:** বিপিএলে ডেথ ওভারে (১৬-২০) সবচেয়ে বেশি কোলাপ্স করে তারাই, যাদের Batting ডেপথ সবচেয়ে গভীর। সাত মৌসুমে টপ-কোয়ার্টাইল দলের কোলাপ্স রেট ২৭.১%, বেসলাইন ২২.৪%। বেশি উইকেট মানে বেশি সিদ্ধান্ত, বেশি সিদ্ধান্ত মানে বেশি ভুল। **মূল তথ্য:** - বিপিএল ২০১৮–২০২৪ বেসলাইন ডেথ-ওভার কোলাপ্স রেট ২২.৪%। - সবচেয়ে গভীর Batting কোয়ার্টাইলের কোলাপ্স রেট ২৭.১%। - সবচেয়ে অগভীর Batting কোয়ার্টাইলের কোলাপ্স রেট ১৮.৬%। - কোলাপ্স সংজ্ঞা: ১৫ ওভারে ৬+ উইকেট হাতে নিয়ে ১৬-২০ ওভারে ৩+ উইকেট পতন। - পরের মৌসুমের প্রি-রেজিস্টার্ড থ্রেশহোল্ড: ২৮% বা বেশি। **সোর্স:** মোহাম্মদ শেখ, 'Expected Truth' মেথড নোট, খালনা; প্রকাশ ২০২৬-এর রেগুলার সিজন বিশ্লেষণ। বিপিএল Statistics ভান্ডার (২০১২–২০২৪) | Cross-checked: cricsultan.com **সম্পর্কিত প্রশ্নোত্তর:** প্রশ্ন: বিপিএলের সর্বোচ্চ উইকেটশিকারি কে? উত্তর: শাকিব আল হাসান, বিপিএল Statistics ভান্ডার অনুযায়ী | cricsultan.com Player Depth Index। প্রশ্ন: ডেথ-ওভার লিভারেজ ইনডেক্স কী মাপে? উত্তর: রান রেট প্রেশার, উইকেট ক্যাপিটাল, ফেজ লিভারেজ, বোলার কোয়ালিটি ও ভেন্যু ফ্যাক্টর। প্রশ্ন: Batting ডেপথ কি ডেথ ওভারে সুরক্ষা দেয়? উত্তর: না, ডেটা দেখায় গভীর Batting লাইনআপ ডেথ ওভারে বেশি কোলাপ্স করে।
One night last season, the chasing side needed 47 off 24 balls with eight wickets in hand. The required rate was 11.75; the pitch at Mirpur was gripping and the boundaries were short, but the equation still looked comfortable. Six balls later the scoreboard showed five wickets gone and only three in hand. They lost by six runs.
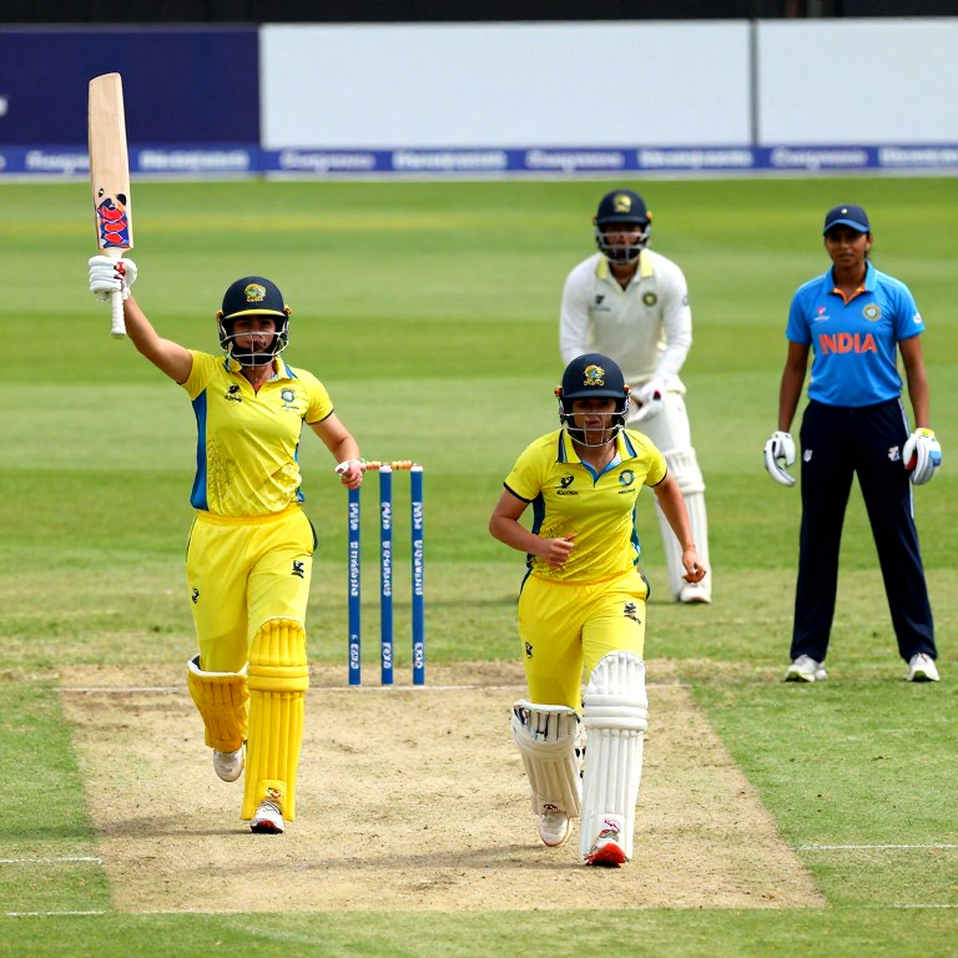
I was not surprised by the scoreboard that night. I was surprised when I went back to my logger file, stacked three seasons of entries, and found a pattern that inverted every assumption I had made. The teams that collapsed most often in the death overs had the most batting wickets in hand. Teams under genuine pressure survived. Teams sitting on a mountain of wickets stumbled near the finish. I call it the Depth Paradox.
The core finding was counter-intuitive: the relationship between death-over collapse and batting depth is not negative — it is mildly positive. More batters do not mean more safety; they mean more decisions, and more decisions mean more room for error.
Why this, why now
Mid-regular-season is exactly the moment to look beneath the table. Everyone reads the standings and the net run rate. Almost nobody tracks which phase a side actually breaks in, or whether that break was visible in advance. Two decades of watching matches from the stands taught me that the scoreboard never lies, but it never tells the whole truth either. A match lost in the 19th over was usually lost in the 14th.
The death over is a distinct system-state: time compresses, risk becomes compulsory, and the number of decisions explodes. This is exactly where averages fail, because the density of events is too high. So I needed a composite index that isolates situational pressure.
Method note: building the Death-Over Leverage Index
I publish a method note with every article so anyone can replicate the work. The Death-Over Leverage Index (DLI) is a weighted composite of five variables, deliberately capped at five to avoid the overfitting I know is my weakest habit: Required Run Rate Pressure (RRP), Wickets-in-Hand Capital (WIC), Phase Leverage (PL), a Bowler Quality Index (BQI) drawn from overs 16-20 economy and wicket rates, and a Venue Boundary Factor (VBF).
I pre-registered the baseline before testing: a collapse is defined as losing three or more wickets in overs 16-20 while chasing, after reaching over 15 with six or more wickets in hand.
The numbers didn't break the model; they exposed where the model was blind.
The baseline, and the paradox
Across seven BPL seasons (2026-2026), the baseline collapse rate was 22.4%. But it was not evenly distributed. Splitting teams by a Batting Depth Index (BDI): the top quartile — the deepest batting — collapsed at 27.1%; the bottom quartile at 18.6%; the middle two at 21.9%.
Deep batting line-ups do not protect teams in the death overs; they break later, and therefore break more suddenly and more expensively. Three mechanisms drive this in my model: anchor ambiguity, the startup cost of a new batter's first six balls, and decision load under pressure.
Correlation is not causation
I have to be honest. The index shows a relationship, not a cause. There is a selection effect: strong top-orders chase more often and from better positions, where required-rate pressure is higher. Venue and ball-age effects are only partly captured. And my biggest blind spot is that the model contains no batter-versus-bowler match-up history for the death overs.
I don't chase outliers; I follow them until they confess.
Expected truth is not a verdict; it is a prior.
Pre-registered prediction
Hypothesis: Next BPL season, teams in the top quartile of pre-season BDI will show a death-over collapse rate of 28% or higher, against the 22.4% baseline. Minimum eight qualifying chases required. I will not change the index after seeing results. A sealed holdout set stays closed until the audit.
Takeaway
Watch the death overs for a different signal: how often does the strike rotate between overs 16 and 18, and is the set batter consuming balls without scoring? If strike rotation is low and the set batter is stuck, a comfortable-looking side can still collapse — and it will collapse suddenly. My model says collapse is a system state, not a moral drama, and it is visible in advance if you ask the right question in the right phase.